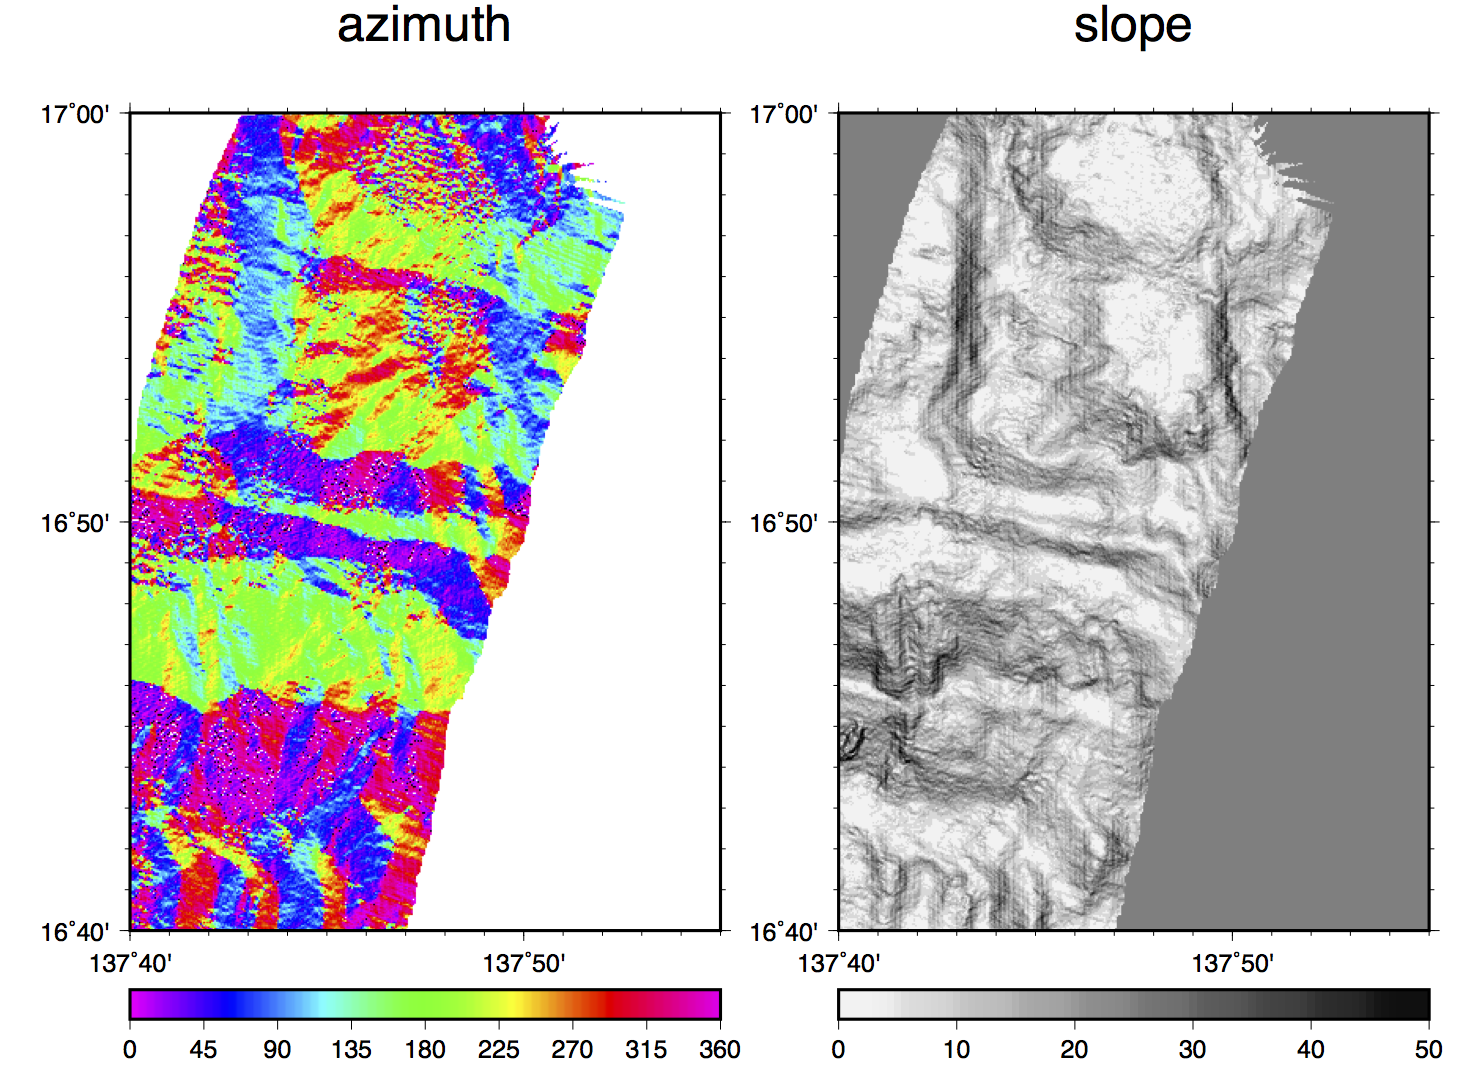
calculating slope and azimuth 
 使うコマンド grdgradient, grdmath (図化にgrdimage, colorbar, basemap)
bash スクリプト例
# calculate azimth/slope and plot
# parameter setting
region=137:40/137:55/16:40/17 # grid region east/west/south/north
proj=M10
# map projection and scale
ticks=f1ma10m
# boundary tick info
frame1=WSne+tazimuth
# boundary frame info
frame2=WSne+tslope
# boundary frame info
grdfile=area.neargrd
# bathymetry grid file
azimfile=area_azim.grd
# output azimuth file (degree)
slopefile=area_slope.grd
# output slope in azimthal direction (degree)
cptfile_azim=azim.cpt
# color table for azimth (manulally created)
climit=0/50/5
# color limit for slope
#
# calculate azimth / slope
gmt grdgradient $grdfile -Stmpslope.grd -D -M -G$azimfile -V
gmt grdmath tmpslope.grd ATAN PI DIV 180 MUL = $slopefile
#
# plot
gmt begin area_analysis
gmt grdimage $azimfile -R$region -J$proj -C$cptfile_azi m
gmt colorbar -Dx1/-1.5+w8/0.3+h -B45 -C$cptf ile_ azim
gmt basemap -B$ticks -B $frame1
#slope
gmt makecpt -Cgray -T$ climit -I
gmt grdimage $slopefile -R$region -J$proj -X12
gmt col orbar -DJBC -B10
gmt basemap -B$ticks -B$frame2
gmt end show
#
Tips
- 地形データから地形の最大傾斜の方向とその方向の傾斜角を計算する
- grdgradientで簡単に計算できるが、この場合方位角の単位は来たから時計回りでdegree, 傾斜角はtangentで出る。このスクリプトではgrdmathを使って傾斜角も角度(degree)で出るようにしている。
- リニアメントの抽出などはslope.cptを変更して、ある程度より傾斜が大きいところだけを着色すると、かなり客観的に抽出作業ができる。
- 方位角は最大傾斜で上向きの方向なので、記載するときのふつうの書き方(「西向き斜面」など)と逆になる。いやならgrdmathで180度足しておく。
- このスクリプトではazimuthのカラーテーブルは既にある場合で-Cオプション付きの描画,slopeはこのスクリプト中にmakecptで作成して保存されずにルクリプト内で使用されるのみ.図のazimは、rainbowパレットを使ってmakecptで作ったカラーテーブルをマニュアルで修正して、0と360が同じ色で輪になるようにつくったもの。