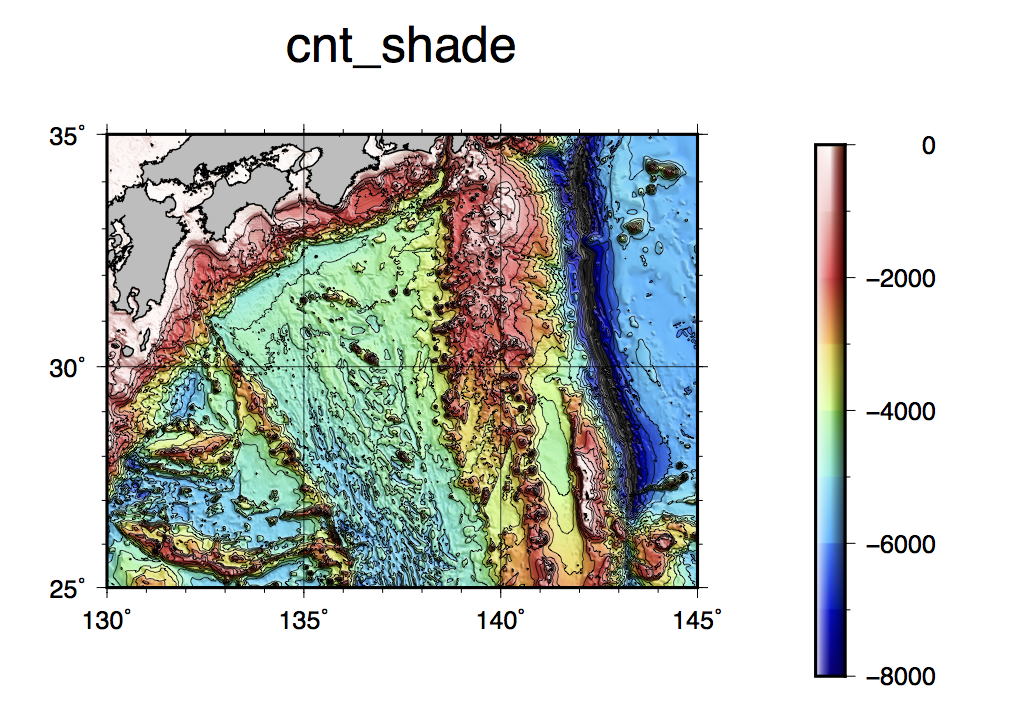
color shaded relief + contour - 陰影図に等深線を重ねる 
 使うコマンド makecpt, grdgradient, grdimage, grdcontour, colorbar, coast basemap
bash スクリプト例
# plot bathymetry color fill map
# parameter setting
region=130/145/25/35
# map region east/west/south/north
proj=M10
# map projection and scale
ticks=a5f1g5
# boundary tick info
frame=WSne+tcnt_shade
# boundary frame info
climit=-8000/0/1000
# color table min/max/interval
light=0/90
# shade direction
cint=500
# contour interval
limit=-10000/-500
# contour min/max
grdfile=JTOPO1_30.grd
# input bathymetry grid file
intfile=JTOPO1_30.int
# intencity (shade) file
#
# plot
gmt begin colshadecnt
gmt makecpt -Chaxby -T$climit -Z
gmt grdgradient $grdfile -A$light -G$intfile -Ne0.6
gmt grdimage $grdfile -R$region -J$proj -I$intfile
gmt grdcontour $grdfile -C$cint -Wthinnest -L$limit
gmt colorbar -DJMR -B1000a2000
gmt coast -Di -Ggray -Wthin,black
gmt basemap -B$ticks -B$frame
gmt end show
#
Tips
- 等深線の太さを細く(thinnest)にして陰影を邪魔しないようにすると上品な仕上がりに(ウェブ上は画像解像度を落としているので太く見えているが)