plot survey points and lines - 観測点(線)の記入 
 使うコマンド makecpt, grdimage, plot, text,colorbar, coast, basemap
bash スクリプト例
# plot points and draw survey lines
# parameter setting
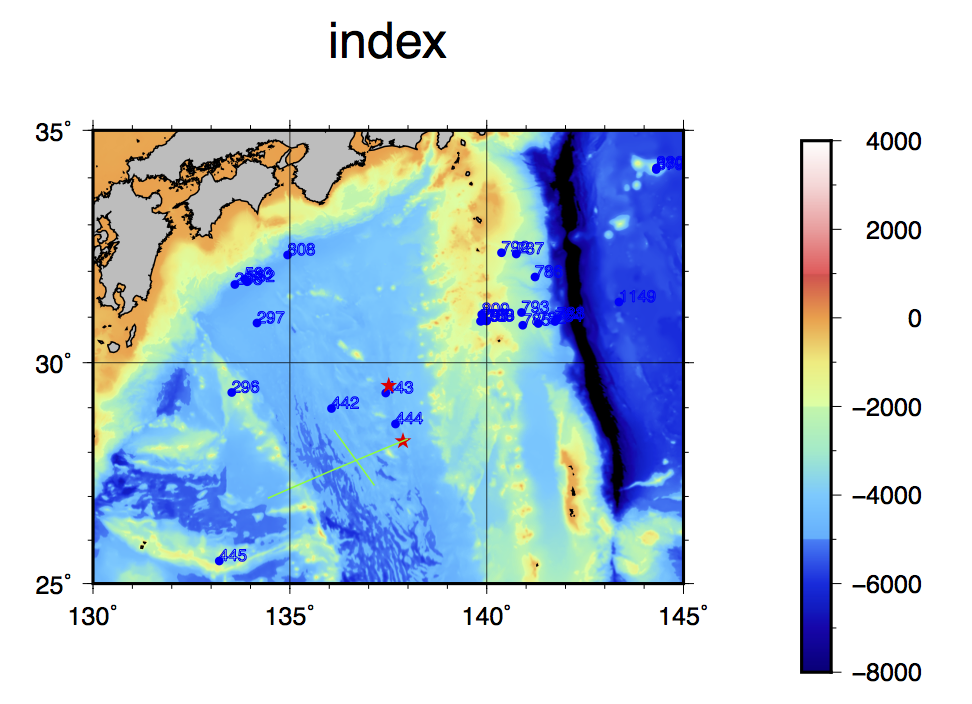
region=130/145/25/35
# map region east/west/south/north
proj=M10
# map projection and scale
ticks=a5f1g5
# boundary tick info
frame=WSne+tindex
# boundary frame info
climit=-8000/4000/1000
# color table min/max/interval
textfont="+f8p,Helvetica,-=0.5p,blue+jBL" # text size,font,color, justification
grdfile=JTOPO1_30.grd
# input bathymetry grid file
pointlist=DSDP.list
# input station location data
linelist=line.list
# input line location data
#
# plot
gmt begin colfil_index
gmt makecpt -Chaxby -T$climit -Z
gmt grdimage $grdfile -R$region -J$proj
gmt plot $pointlist -Sc0.15 -Gblue
gmt text $pointlist -R$region -J$proj -F$textfont
gmt plot -Sa0.30 -Gred << END
137.5134 29.49045
137.8729 28.25310
END
gmt plot $linelist -Wthin,green
gmt colorbar -DJMR -B1000a2000
gmt coast -Di -Ggray -Wthin,black
gmt basemap -B$ticks -B$frame
gmt end show
#
Tips
- 観測点などを描く場合、数点であれば、図中星印を描いている場合のようにスクリプト直接記入でもよい。別にインプットファイルを用意する場合は、(経度、緯度、値)のテキストを用意する(ENDの前にタブキーが入っているとエラー)
- modernではpsxy, pstextのかわりにplot, textとなる.plotでシンボルを指定しないと直線をつないで描いていく。複数の測線位置をひとつのファイルに入れる場合は、測線ごとにレコード区切り">"の行を入れる
- 上記の例では、測点番号は、BL(bottom
left)で文字の左下が座標位置になるよう指定。フォントや位置指定を入力ファイルに書いておく方法もあって、点ごとに指定を細かく変えたい場合はその
ほうがよい(でもちょっとの重複ならお絵かきソフトで後で動かすほうが簡単)