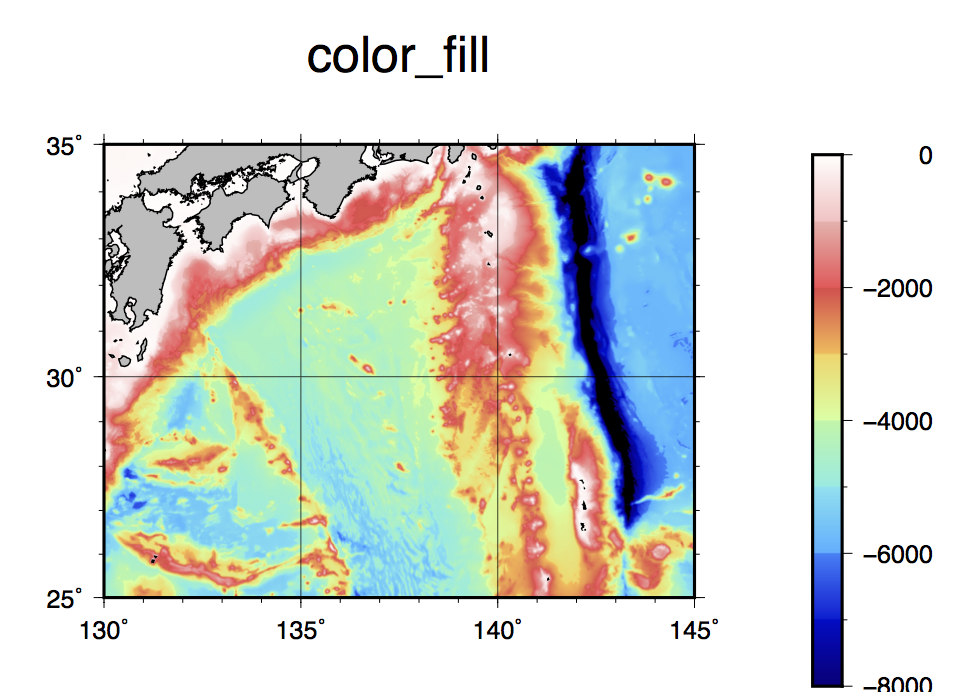
color image map - 水深に応じて彩色した図をつくる 
 使うコマンド makecpt, grdimage, colorbar, coast, basemap
bash スクリプト例
# plot bathymetry color fill map
# parameter setting
region=130/145/25/35
# map region east/west/south/north
proj=M10
# map projection and scale
ticks=a5f1g5
# boundary tick info
frame=WSne+tcolor_fill
# boundary frame info
climit=-8000/0/1000
# color table min/max/interval
grdfile=JTOPO1_30.grd
# input bathymetry grid file
cptfile=haxby_grad.cpt
# color table
psfile=colfil.ps
# output postscript file name
#
# making color table
gmt makecpt -Chaxby -T$climit -Z > $cptfile
#
# plot
gmt begin colfil
gmt makecpt -Chaxby -T$climit -Z
gmt grdimage $grdfile -R$region -J$pr oj
gmt colorbar -DJMR -B1000a2000
gmt coast -Di -Ggray -Wthi n,black
gmt basemap -B$ticks -B$frame
gmt end show
Tips
- このスクリプト例ではカラーテーブルの扱いがclassicとかなり変わる.デフォルトでは,カラーテーブルをあらわには出力しない.makecptで指定したカラーテーブルがgrdimageやcolorbarに自動的に引き継がれるので,-Cオプションなしで走る.ただし,カラーテーブルをマニュアルで調整したり,既に存在する.cptファイルを利用したい場合は,classic同様に-Cオプションをgrdimageやcolorbarコマンドに追加する必要がある.また,coastやbasemapはpscoastやpsbasemapとほとんど変わらないが,colorbarは位置指定などが少し違う(気がする).この例は,デフォルト設定で右側にカラーバーを描く例だが,-Dxとするとかつてのpsscaleのように厳密に場所指定ができる.