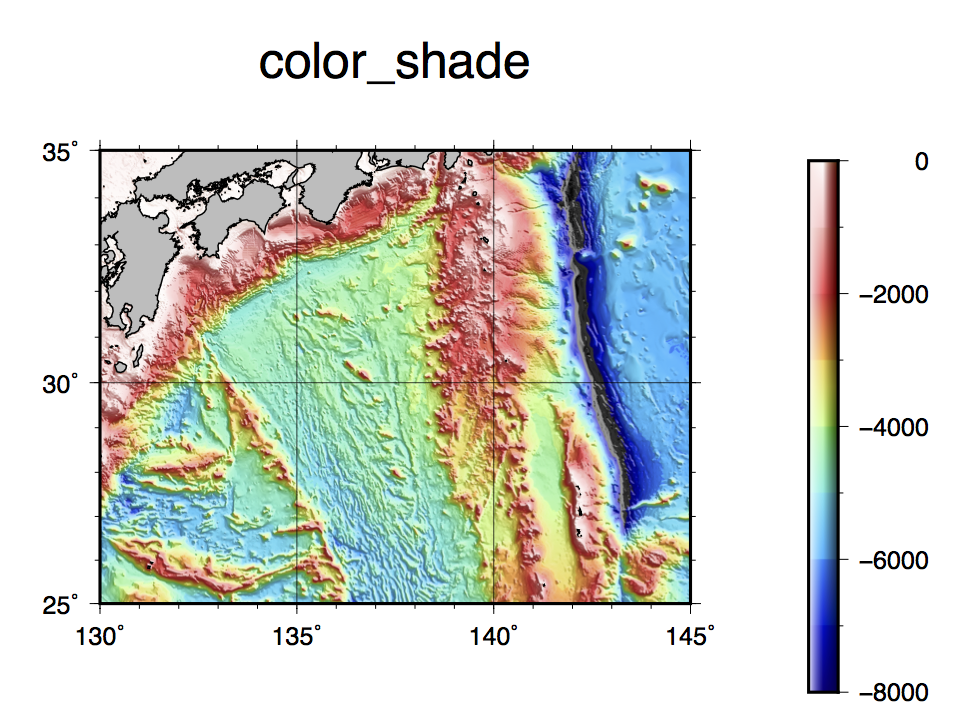
color shaded relief - 堿塭恾傪偮偔傞乮岝傪偁偰偰棫懱揑偵傒偣傞乯
 巊偆僐儅儞僪丂丂makecpt, grdgradient, grdimage, colorbar, coast basemap
bash 僗僋儕僾僩椺
# plot bathymetry color fill map
# parameter setting
region=130/145/25/35
# map region east/west/south/north
proj=M10
# map projection and scale
ticks=a5f1g5
# boundary tick info
frame=WSne+tcolor_shade
# boundary frame info
climit=-8000/0/1000
# color table min/max/interval
light=0/90
# shade direction
grdfile=JTOPO1_30.grd
# input bathymetry grid file
intfile=JTOPO1_30.int
# intencity (shade) file
#
#
# plot
gmt begin colshade
gmt makecpt -Chaxby -T$climit -Z
gmt grdgradient $grdfile -A$light -G$intfile -Ne0.6
gmt grdimage $grdfile -R$region -J$proj -I$intfile
gmt colorbar -DJMR -B1000a2000
gmt coast -Di -Ggray -Wthin,black
gmt basemap -B$ticks -B$frame
gmt end show
#
Tips
- 抧宍偺孹幬偐傜摿掕偺曽岦偐傜岝傪偁偰偨応崌偺堿塭傪寁嶼偟丄grdimage偱-I巜掕偡傞偲晜偒挙傝幃偺抧宍恾偑摼傜傟傞丅捈姶揑偵抧
宍傪棟夝偡傞偙偲偑偱偒丄捁嵴恾偲堘偭偰丄巰妏偑側偔丄嫍棧傗曽岦傪寁應偟傗偡偄偺偲偙傠偑棙揰丅儌僲僋儘偱傕斾妑揑棫懱姶傪弌偣傞偺偱丄梡搑偼峀偄丅
- 偁傞曽岦偺抧宍梫慺傪嫮挷偟偨偄乮専弌偟偨偄乯応崌偼$light偱巜掕偟偰偄傞曽岦傪侾曽岦偲偟丄乕N僆僾僔儑儞偺暯妸壔僷儔儊僞傪挷惍偟偰摿掕憱岦偺抐憌抧宍側偳傪嫮挷偡傞偙偲偑偱偒傞
- 慡懱偲偟偰尒塰偊偺傛偄恾傪偮偔傞応崌偼丄偙偺僗僋儕僾僩偺傛偆偵俀曽岦乮90亱偢傟偺昁梫偼側偄乯偐傜岝傪偁偰傞偲傛偄丅
- 戩墇偡傞曽岦惈偑俀偮偁傝偠偭偔傝夝愅偟偨偄応崌偼丄偦傟偧傟偺曽岦偺岝傪偁偰偨摨偠巇條偺恾傪暿乆偵2枃偮偔傝丄Illustrator偱廳偹偰摟柧婡擻傪巊偆曽朄傕偁傞