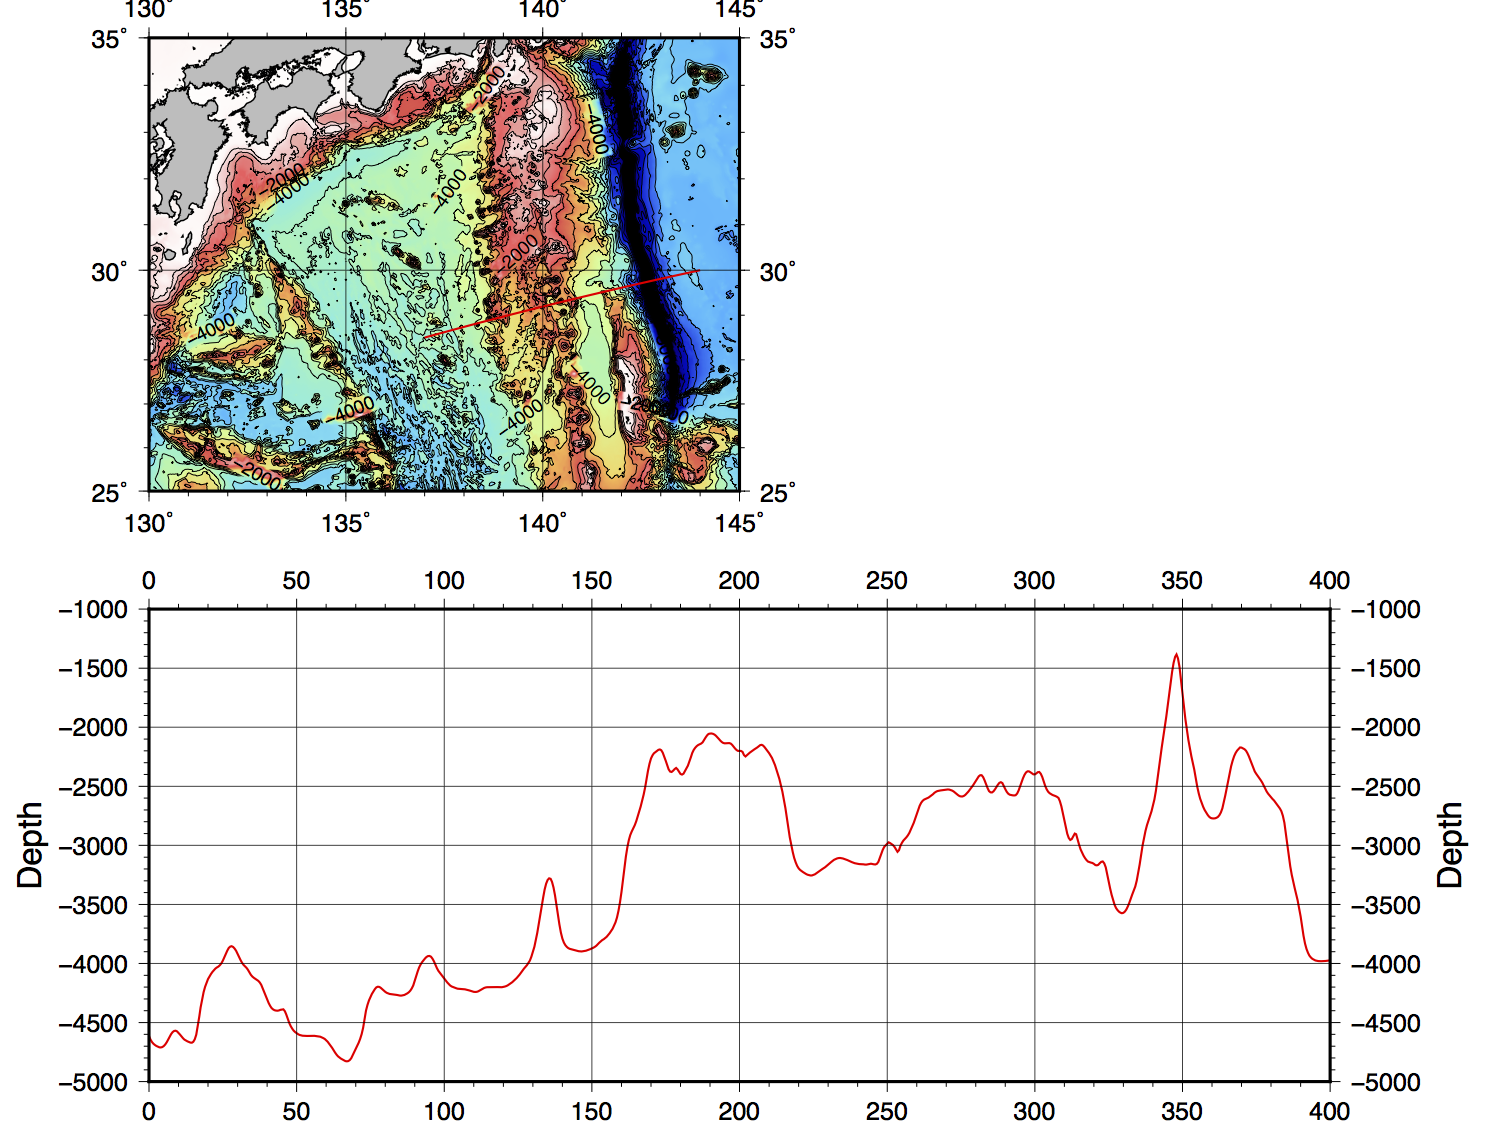
plot profile - グリッドデータから任意の断面図を作成する 
 使うコマンド makecpt, grdimage, grdcontour, plot, coast,basemap
bash スクリプト例
# plot bathymetry profile and color index map
# parameter setting
region=130/145/25/35
# map region east/west/south/north
proj=M10
# map projection and scale
ticks=a5f1g5
# boundary tick info
frame=WSne
# boundary frame info
climit=-8000/0/1000
# color table min/max/interval
cint=500
# contour interval
limit=-10000/-500
# contour min/max
aint=2000
# annotation contour interval
grdfile=JTOPO1_30.grd
# input bathymetry grid file
start_loc=137:00/28:30
# profile start point
end_loc=144/30
# profile end point
dist=0.5
# sample interval along profile
prodatfile=profile1.xyz
# profile data file
proregion=0/400/-5000/-1000 # profile region
proproj=x0.05/0.002
# profile projection (cartesian) and scale
pticksx=f10a50g50 # profile boundarytick info
pticksy=f100a500g500+lDepth: # profile boundarytick info
# extract values along track from grid file
gmt project -C$start_loc -E$end_loc -G$dist -Q -V > tmpfile
gmt grdtrack tmpfile -G$grdfile -L -V > $prodatfile
#
# plot index map
gmt begin profile+index
awk '{print $3,$4}' $prodatfile | gmt plot -R$proregion -J$proproj -Bx$pticksx -By$pticksy -Wthick,red
gmt makecpt -Chaxby -T$climit -Z
gmt grdimage $grdfile -R$region -J$proj -Y10
gmt grdcontour $grdfile -C$cint -A$aint -L$limit -Wthinner
gmt coast -Di -Ggray -Wthin,black
gmt plot $prodatfile -Wthick,red
gmt basemap -B$ticks -B$frame
gmt end show
#
Tips
- このスクリプトのprojectコマンドでは断面の両端の緯度経度を-C, -Eオプションで指定しているが、端点と方位を指定する方法もある。
- この断面図は横軸を距離にしてあるが、緯度や経度を横軸にしたい場合はawkの中を書き換える。
- 真っ黒がよくないと思う場合は、climitの下限を(データがなくても)ずっと下にすると、標準カラーパレットの中央部だけ使える