color filled contour map 2 - 段彩で等深線を強調する 
 使うコマンド makecpt, grdimage, grdcontour, pscoast, psbasemap
bash スクリプト例
# plot bathymetry color fill map
# parameter setting
region=130/145/25/35
# map region east/west/south/north
proj=M10
# map projection and scale
ticks=a5f1g5
# boundary tick info
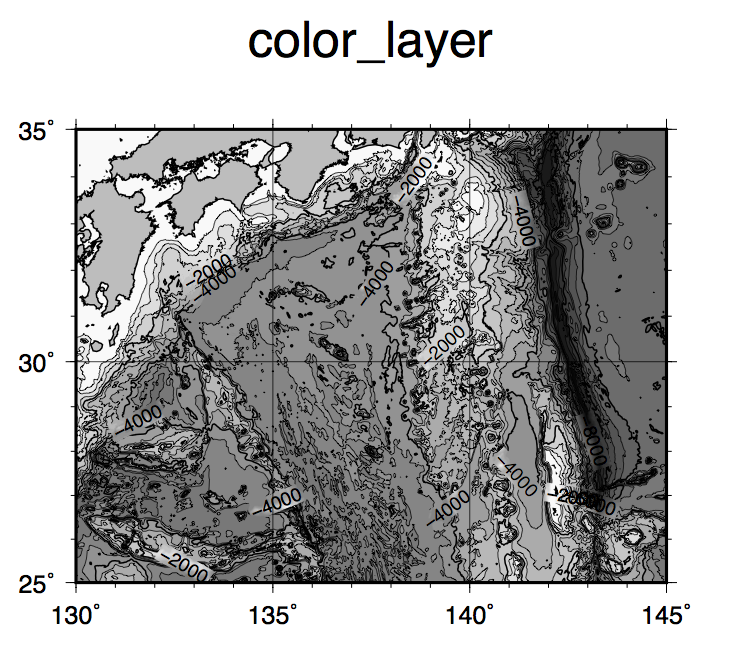
frame=WSne+tcolor_layer # boundary frame info
climit=-8000/0/1000
# color table min/max/interval
cint=500
# contour interval
limit=-10000/-500
# contour min/max
aint=2000
# annotation contour interval
grdfile=JTOPO1_30.grd
# input bathymetry grid file
cptfile=gray_step.cpt
# color table
psfile=colfilcnt2.ps
# output postscript file name
#
# making color table
gmt makecpt -Cgray -T$climit -V > $cptfile
#
# plot
gmt grdimage $grdfile -R$region -J$proj -C$cptfile -K -V > $psfile
gmt grdcontour $grdfile -R$region -J$proj -C$cint -A$aint -L$limit -K -O >> $psfile
gmt pscoast -R$region -J$proj -Di -Ggray -Wthin,black -K -V -O >> $psfile
gmt psbasemap -R$region -J$proj -B$ticks -B$frame -O -V >> $psfile
#
Tips
- 論文などで白黒図版が必要な場合、グレースケールをグラデーションでつくる(makecptで-Zコマンドをつける)とわかりにくく、むしろ色が境界値で不連続に変わる(段彩)のほうがわかりやすい
- 等深線間隔cintとカラーテーブルの間隔(climitの最後のパラメタ)を一致もしくは整数倍にすること
- 真っ黒がよくないと思う場合は、climitの下限を(データがなくても)ずっと下にすると、標準カラーパレットの中央部だけ使える